Technical analysis is a powerful tool used by traders and investors to analyze past market data and forecast future price movements. By understanding the various tools and strategies of technical analysis, individuals can gain insights into market trends and make informed trading decisions. This blog aims to unveil the secrets of technical analysis, covering essential tools and strategies applicable to both the USA and Indian markets.
Understanding Technical Analysis:
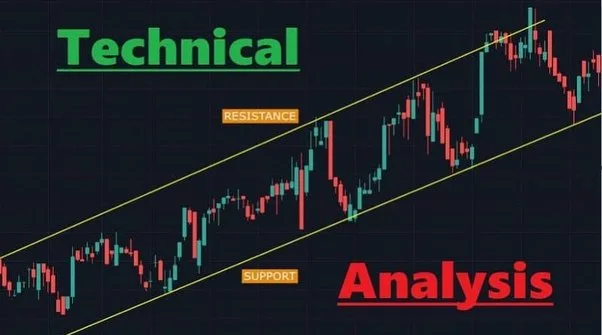
- Price Charts: Technical analysis relies heavily on price charts, which display historical price movements of a security over time.
- Market Indicators: Various technical indicators, such as moving averages, MACD, and RSI, provide insights into market momentum, trend strength, and potential reversals.
- Support and Resistance Levels: Key support and resistance levels represent price levels where buying or selling pressure is expected to be significant.
- Chart Patterns: Recognizing chart patterns, such as triangles, head and shoulders, and flags, can help identify potential trend reversals or continuations.
Applying Technical Analysis in the USA Market:
- Trend Identification: Using moving averages and trendlines to identify the direction of the trend.
- Trading Signals: Utilizing technical indicators like MACD and RSI to generate buy or sell signals.
- Risk Management: Setting stop-loss orders based on support and resistance levels to manage risk.
- Pattern Recognition: Identifying chart patterns such as double tops or bottoms to anticipate potential price movements.
Applying Technical Analysis in the Indian Market:
- Candlestick Patterns: Analyzing candlestick patterns to gauge market sentiment and potential reversals.
- Volume Analysis: Examining trading volume to confirm the validity of price movements.
- Fibonacci Retracement: Using Fibonacci levels to identify potential support and resistance levels.
- Sector Analysis: Applying technical analysis techniques to analyze sectoral indices and individual stocks in the Indian market.
Strategies for Effective Technical Analysis:
- Multiple Timeframe Analysis: Analyzing charts across different timeframes to confirm trends and trading signals.
- Risk-Reward Ratio: Ensuring that potential profits outweigh potential losses by maintaining a favorable risk-reward ratio.
- Backtesting and Validation: Testing trading strategies on historical data to assess their effectiveness before implementing them in live markets.
- Continuous Learning: Staying updated with new technical analysis tools and refining trading strategies based on market conditions and experience.
Conclusion:
Technical analysis is a valuable tool for traders and investors seeking to analyze market trends and make informed decisions in both the USA and Indian markets. By understanding price charts, market indicators, and chart patterns, individuals can uncover trading opportunities and manage risk effectively. Incorporating technical analysis into one’s trading strategy requires continuous learning, practice, and adaptation to changing market dynamics. With the right tools and strategies, technical analysis can unveil the secrets of market movements and empower individuals to achieve their financial goals.